GA4 BigQuery Cost Estimator in Waaila
Are you considering linking your GA4 data to BigQuery and are unsure of the costs? Waaila introduced a simple calculator to estimate the price for BigQuery Storage. The price is estimated right from your data.
Published: Aug 13th 2022 | 7 min read

When transitioning from to Google Analytics 4 (GA4), users are usually recommended to start using the BigQuery services to store and analyse their data. However, the price of BigQuery services is not straight forward. It depends on the data ingestion option, the data location and several individual aspects, such as the amount of queries or the long and short-term storage. To simplify the price derivation we have created in Waaila a way to estimate the price directly from your data.
The BigQuery Cost Estimator allows you to connect to your Google Analytics (Universal Analytics) data and estimate the BigQuery services’ price based on your data. If you already have representative data in a GA4 property, you can use the BigQuery estimator prepared for GA4 data. Apart from the cost estimator the same template lets you compare your daily data to the GA4 BigQuery export daily limit and displays the amount of data by hit type. In the sections below we describe how to set and interpret both the estimator and the export limit comparison.
BigQuery Cost Estimator
In the cost estimator you can select the data import method and indicate the extend to which expect to run analyses. The calculator evaluates your monthly traffic and based on it estimates the size of active and long-term storage, as well as the size of import to the BigQuery service. The calculator automatically incorporates the thresholds for free resources and provides overview of the estimated price and size for each service.
Configuration
To set the data import method, there is a parameter called dataImportMethod which takes two values: streaming or batchLoad. If you use the daily batch export method, select the value batchLoad. This method is free but it has a limit of 1 million events daily (in the premium version it is over 1 billion). When the limit is exceeded, you have to use the streaming (select the value streaming).
To indicate the extent to which you expect to run analyses, there is a parameter called expectedAnalysisAmount which takes 3 values: low, average and high. This indicates the volume of analyses (queries) you run on your data in BigQuery in comparison to your monthly amount of data. If you select the value low, the monthly volume of analyses corresponds to the monthly amount of data. The value average indicates a volume of roughly 10 times the monthly amount of data and the value high indicates the volume of roughly 50 times the monthly amount of data.
The prices as well as the free resources depend on the location of the resource. We provide the default values in the BigQuery Cost Estimator for location EU (multi-region). Parameters for different locations can be extracted from official documentation and configured in the calculator using the parameter priceConfig. The parameter contains separate parts for each priced service: analyses, active storage (shorter than 90 days), long-term storage (above 90 days) and streaming import. For each service there is configuration of the price per volume unit, the amount of free volume as well as the volume units in byte multiples (e.g. GiB stands for gibibyte which is 10243 bytes).
The calculator constructs the data volume based on the assumption of the size of a hit which is set to 2 kiB (2*10242 bytes). This size is set based on our experience with a variety of clients and it corresponds to Google's approximation. If you want to adjust the value, you can set it in the expectedHitSize parameter.
Interpretation
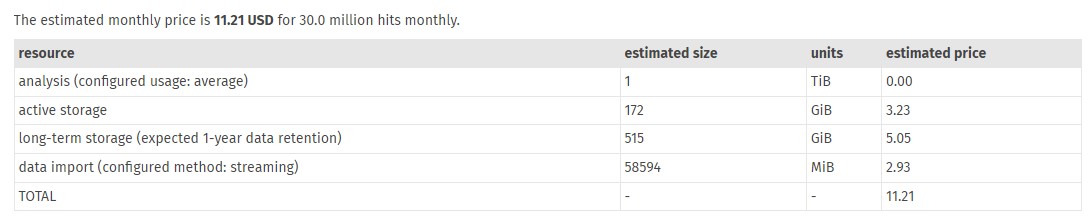
The results show the total price in US dollars for a month of BigQuery services. Moreover, there is a table listing the volume used in the estimate and the price for each priced service. You can thus evaluate which services form the largest part of the price. The total price needs to be interpretted as an estimate constructed based on the configuration and on common usage of the BigQuery service.
Using the example listed below, the user's view contains data with 30 million hits per month which results in estimated price 11.21 US dollars. The price consists of 3.23 USD per active storage and 5.05 USD per long-term storage (based on the estimated size for 3 and 9 months respectively) and lastly 2.93 USD for streaming which is selected as the data import method. There is no price for the analysis because based on the data volume the analysis is not expected to overcome the free units of 1 TiB.
BigQuery Export Limit
There is a limit on the BigQuery batch export. If the volume of data exceeds 1 million events, the export is paused. Thus for a higher volume of data you need to use the paid streaming import. You can learn more details in the documentation on the BigQuery Export. As GA4 events can be approximated by the Universal Analytics (UA) hits, this test compares hits from UA to the threshold and displays the hits separated by their type for better insight.
Configuration
This test evaluates hits using the threshold for free GA property - 1 million - as set in the main parameter dailyExportLimit. For the 360 properties the limit is substantially higher (the documentation on the premium property states the limit as "billions of events"). If your data exceeds the limit, you can adjust the threshold parameter to see by how much the limit is exceeded.
The amount of hits is separated by their type, however, there is no exact evaluation of the timing hits. Therefore the test uses the official caps on the amount timing hits processed daily as an upper estimate for the table report. These caps are based on the amount of pageview hits as can be found in the official documentation.
Interpretation
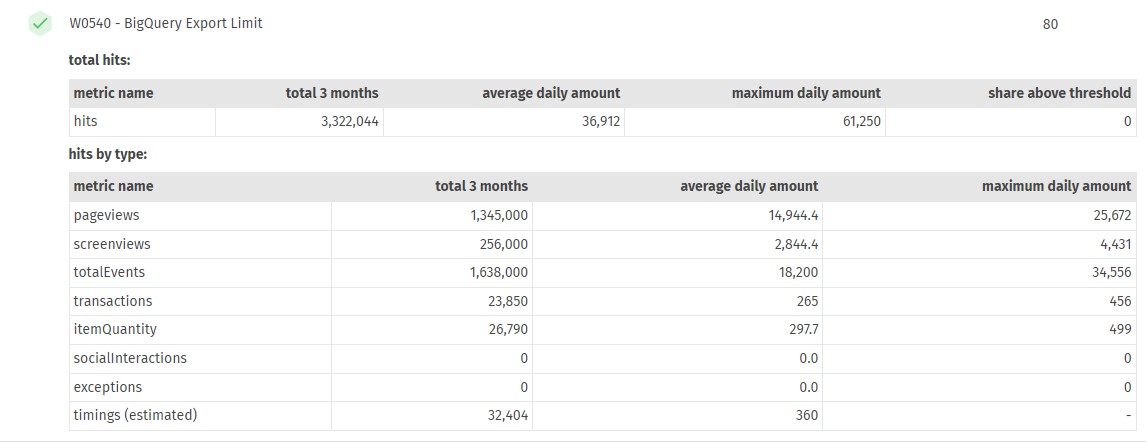
To evaluate the GA4 daily events limit the test compares the average daily amount of hits in your data in the past 3 months. The percentage of days exceeding the configured threshold is displayed in the last column of the first results table. Thus you can see if the threshold is exceeded only in rare events or if you need to set the streaming import.
The results also display the amount of hits separated by the hit type: pageviews, screenviews, classical events in UA, transactions, item (item quantity), social interactions, exceptions and timing hits. Therefore you can evaluate what hit types form the bulk of the hits in the UA and thus you can see what event types will form the bulk of the events in GA4. There is no exact measurement of timing hits to our knowledge and thus they are calculated as the total number of hits minus all other types of hits. The resulting estimate for timing hits is compared to the official caps to ensure the estimate is within the limit.
In the example below, the daily events limit is not exceeded in the past 3 months (maximum daily amount is around 60 thousands). Therefore, the test passes (green check symbol) and awards full score (80 for this test). In the lower table you can see the hits divided into each type. The largest amount is in pageviews and events. There are no measured social interactions or exceptions.